Composable Designer
The Composable Designer is where users can compose, or author, DataFlow Applications. The Composable Designer consists of a rich, modern and web-based user interface design tool for flow-based programming.
To create a new DataFlow, click on DataFlow or select DataFlow > Create New from the sidebar menu.
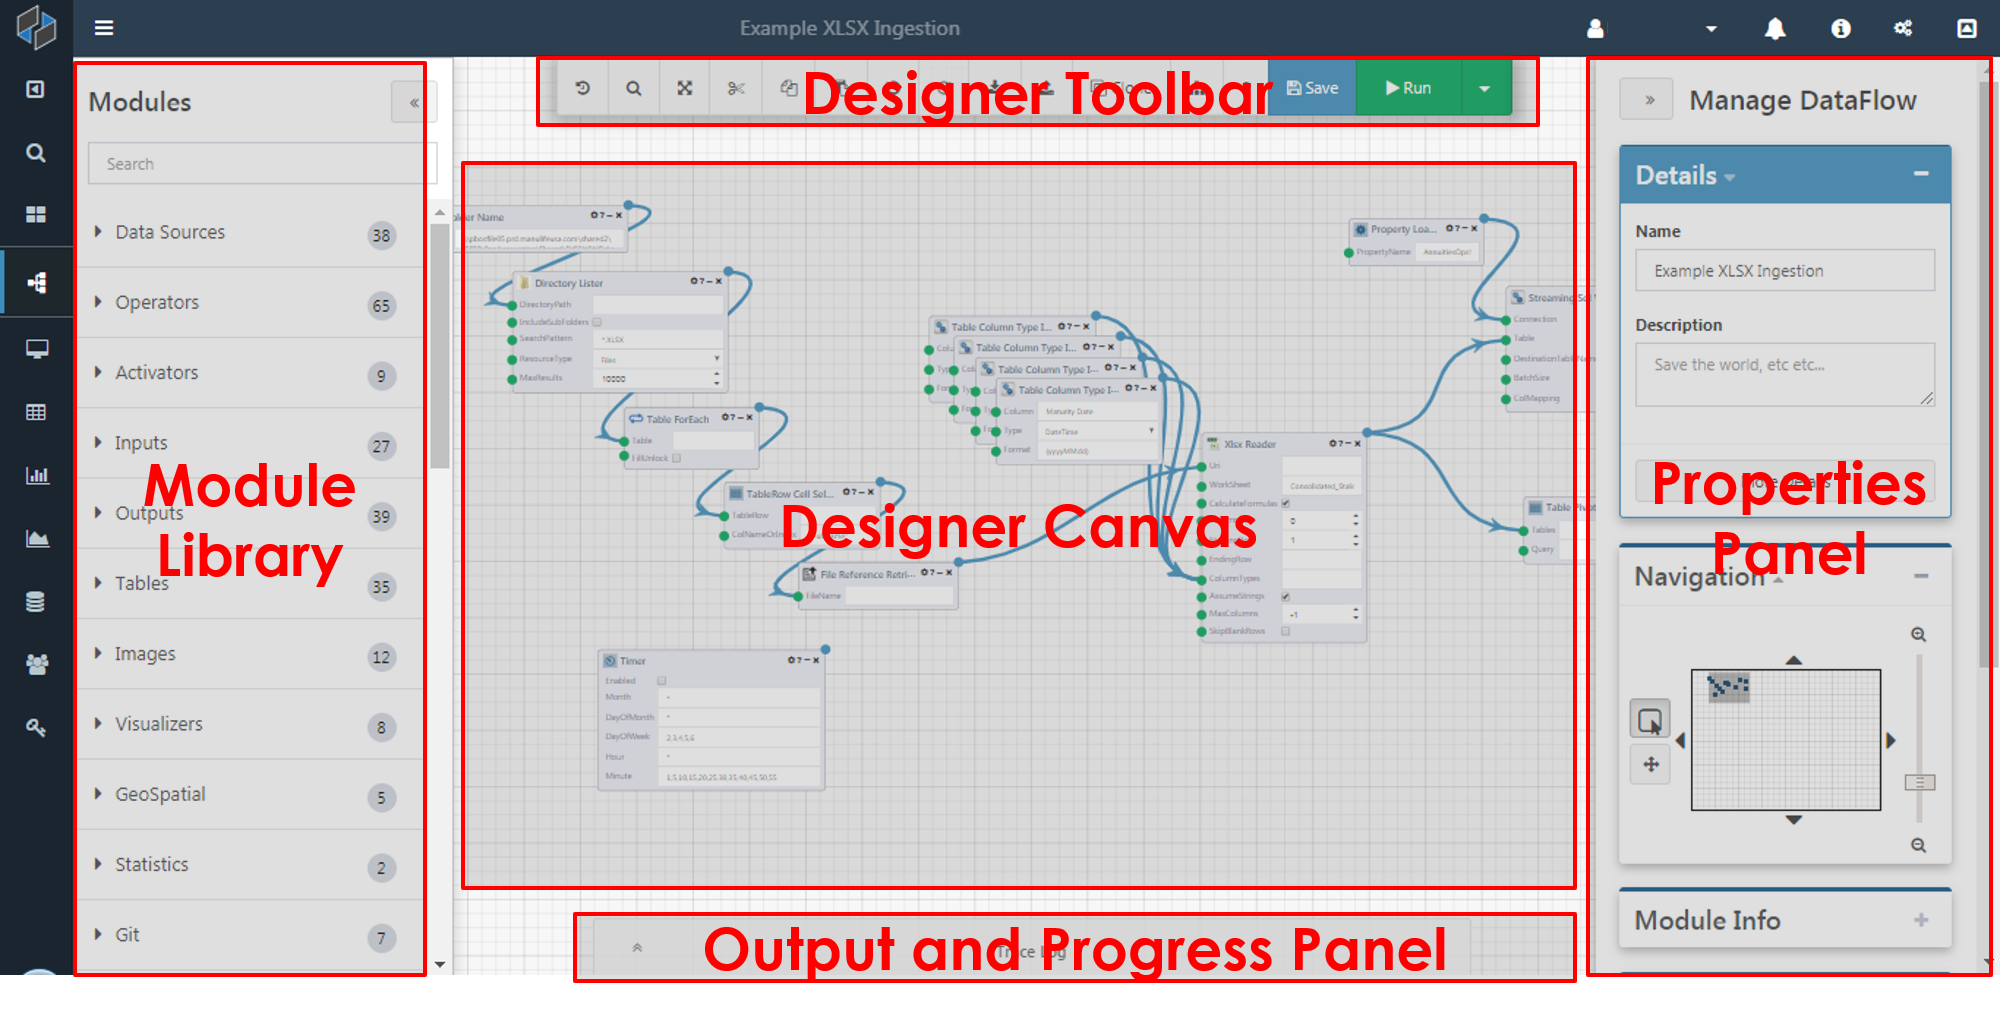
The Composable Designer user interface is made up of five primary areas: the canvas, the Module Library, the toolbar, the properties panel, and the output and progress panel.
Designer Canvas
The canvas area is the main working area for the Composable Designer, where Modules are placed and connected to form full DataFlow Applications. Once Modules are placed on the canvas, they can be moved around, resized, and connected with other Modules.
Note
While the execution order of the Modules is determined by the underlying graph structure of the DataFlow, it is recommended to take a left-to-right or top-to-bottom layout for optimal human-readability.
The canvas is dynamic and large enough for even the most complex DataFlows, but if you find that you need more room, consider encapsulating your DataFlows.
Module Library
The Module Library is available on the left side of the canvas, and lists all of the available Composable Modules. Users can explore the Module Library by clicking on individual categories or by searching for a specific Module name. To add a new Module to the canvas, simply drag and drop it onto the canvas.
Note
Note that Modules may also be added onto the canvas by right-clicking an input or output of an already placed Module and selecting a Module from the suggestion list.
The Module Library may be collapsed, and expanded, by clicking on the collapse/expand buttons. This is a useful feature when users require a larger working area on the canvas and/or when working on a small laptop screen.
Designer Toolbar
The Composable Designer Toolbar is a group of icons in the top-center of the canvas for commonly-performed DataFlow authoring functions.

From left to right:
- Revision History to bring up a view of the change and revision history for the DataFlow application. [Only appears for saved DataFlows]
- Reset-Zoom and Zoom-to-Fit to quickly adjust and toggle between different zoom levels.
- Cut, Copy, and Paste and for Undo and Redo. These are commonly-performed actions, with familiar functionality found in other applications such as text editors and image processing tools.
- Export and Import. In Composable, each DataFlow, including all Module inputs and connections, can be serialized and stored as a file (JSON file with .json file extension). In this way, DataFlows can be exported, locally stored, or pushed to a version control system, and imported across other Composable instances.
- Clone to generate a clone, or copy, of the current DataFlow Application.
- Code to generate a DataFlow Application in code.
- Cleanup to automatically arrange Modules in the canvas.
- Help that provides common keyboard shortcuts
- Save to save the current DataFlow Application.
- Resume: [Only appears for previously executed DataFlows] DataFlow Resume allows you to carry many Module output values from one run to the next. The execution engine detects changes to your DataFlow since the previous run and conditionally determine which Modules need to be re-executed. All other Modules will reuse the results from the previous run.
- Modules whose inputs (connections or values) have been changed since the last run.
- Modules with errors in the previous run.
- Modules that have the
Force Executionoption set. - Modules whose outputs cannot be cached (certain File executors and Property loaders)
- Modules that are downstream of any of the above Modules.
- Run, including a Debug Mode accessible via the dropdown, which allows you to either Run the entire DataFlow, or step through the Modules and inspect intermediate results in Debug mode.
Properties Panel
The Properties Panel, on the right-hand side of the canvas, includes:
-
The Details card for entering in the Name of the DataFlow as well as a Description.
- Renaming DataFlows can be done by simply editing the Name and Saving the DataFlow.
-
The Navigation card for adjusting the current view and zoom level. The currently viewable section of the canvas is highlighted in the thumbnail and can be moved around to pan the canvas.
-
The Module Info card, which provides information on the currently selected Module.
-
The Options card, where global DataFlow-level settings can be applied. These include:
- Avoid Saving Runs: When enabled, the results of previous runs will not be saved in the Run History page.
- Parallel Execution: When enabled, Modules in a DataFlow execute in parallel, as soon as all their input parameters are met.
- Receive Progress Events: When enabled, progress of a run is visible in the designer. See the Output and Progress Panel below.
- Realtime Outputs: When enabled, outputs are available in real-time during a run. See the Output and Progress Panel below.
- Receive Trace Events: When enabled, status progress is available in the trace panel. See the Output and Progress Panel below.
- Error Handling Options: When Error Handling Options is clicked, options are available for Continue on Error and Email on Error behavior.
- The Undo Stack card, which shows the latest actions performed in the dataflow, can be navigated by clicking or using the undo/redo actions to view the DateFlow in a previous state.
The Properties Panel may be collapsed, and expanded, by clicking on the collapse/expand buttons. This is a useful feature when users require a larger working area on the canvas and/or when working on a small laptop screen.
Output and Progress Panel
The Output and Progress Panel is located at the bottom right of the canvas, and is usually initially in a collapsed position labelled Trace Log. Once expanded, three tabs are available:
- Output: Output panel that, once the DataFlow run completes, provides a complete set of outputs per Module.
- Trace: A log of real-time events, including warnings and errors, of a DataFlow run.
- Progress: a Real-time view of a DataFlow run, on a per Module basis, including run statistics (e.g., Module run duration).