Reading Data from the Web
One of the most common steps in any analysis process is to collect and read in your data. This may come from files, an API call, a database query or many other ways. In this page, we'll show an example of reading in data from the web into a Composable Table.
The dataset we'll be using is the BlueBikes trip data. BlueBikes is the bike share system in Boston, and they have the entire trip history for rides taken since they first started in 2014. This is a publicly available dataset.
BlueBikes Historical Trip Data
Here is the DataFlow that you can import into the DataFlow Designer page to follow along. Download Reading BlueBikes Data DataFlow
Getting the List of Filenames
To start, we want to read in the data which is stored as zip files. They have a fairly consistent naming convention YYYYMM-<ProgramName>-tripdata.zip and the full download link is https://s3.amazonaws.com/hubway-data/202101-bluebikes-tripdata.zip. We could write a code script to generate these names, but if we pull the filenames directly from the page, we will not have to change any parameters when new data is added every quarter. Also, BlueBikes switched their name from Hubway in May 2018, so we would have to account for that.
So instead we can go straight to the source, and get the filenames directly. Open up a Composable DataFlow and start with the WebClientmodule. Enter https://s3.amazonaws.com/hubway-data as the Uri and set the Method to GET. This returns an XML string with the contents of the S3 buckets.
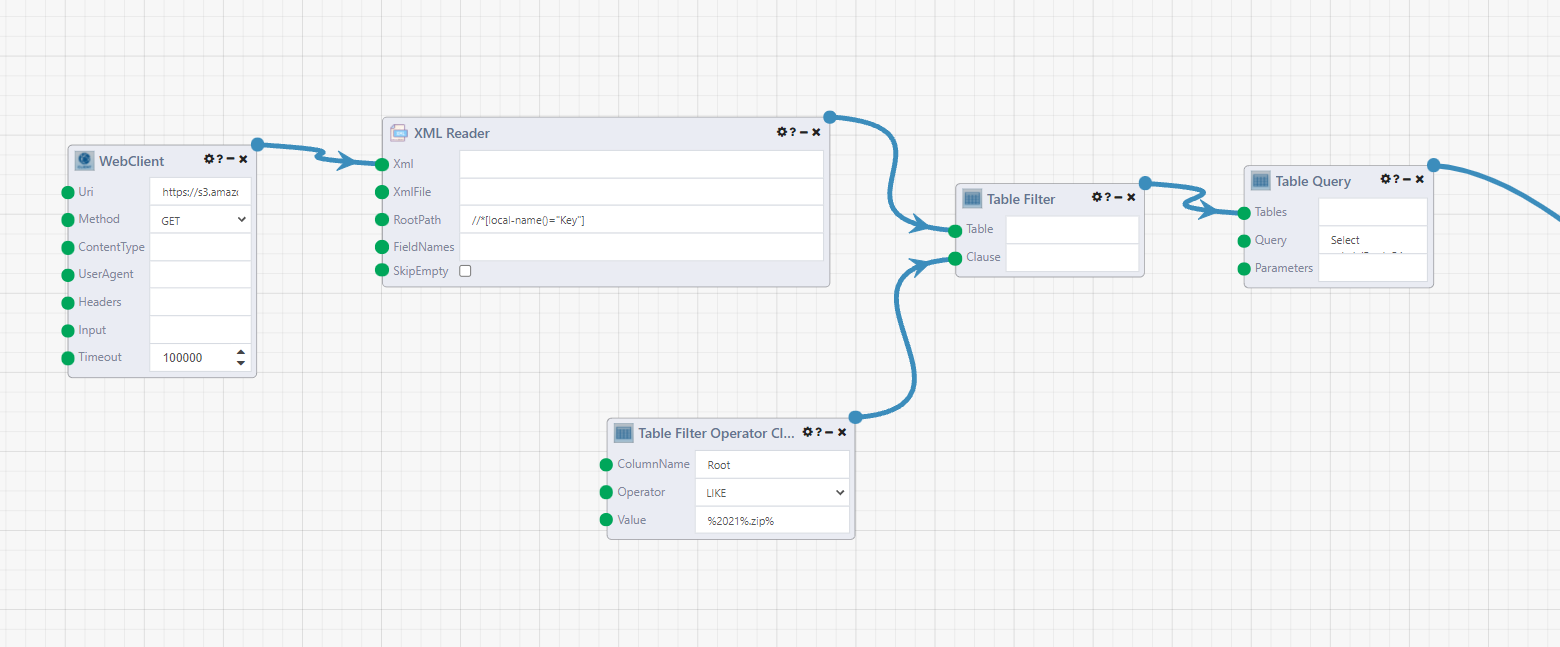
The XML Readerparses the results into a table. Connect the result of the WebClient to the Xml input of the XML Reader. Enter //*[local-name()="Key"] as the RootPath. This is an XPath format. The rows in the output look like <Key xmlns="http://s3.amazonaws.com/doc/2006-03-01/">201501-hubway-tripdata.zip</Key>.
Now we can strip everything except the filenames, and filter to keep the files we want to process. To start, we only want to look at 2021 data, so a Table Filter module will filter the results. Attach the output of the XML Reader module to the Table input. Right click on the Clause input and it will suggest the Table Filter Operator Clause module. Set ColumnName to Root, Operator to LIKE, and Value to %2021%.zip% (Edit: do %20210%.zip% to not read in October data with a different format). This is SQL syntax, so the % are wildcard symbols. This query will filter to only zip files with 2021 in the field.
Note
Starting in October 2021, it looks like BlueBikes started releasing their data in a different format, with a tripID value, and changing the membership types. This will break the Union All happening later so for now, filter out data past this point.
To extract the filenames from the rows, the Table Query module can be used to apply string functions. Enter the query below as the Query.
Select substr(Root, 54, instr(Root,'.zip')-50) AS FileString
FROM [t0]
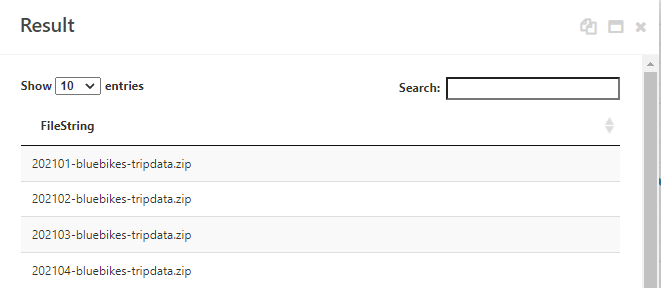
Viewing the results shows that we now have a table of the zip filenames.
Reading in the Files
Next we need to loop through the files and read them in, unzip them, and read the csvs inside into a table.
Start off with the Table ForEach module. This starts a loop that iterates through each row of the module. Later, the Accumulator module will collect the results of the iterations of the loop.
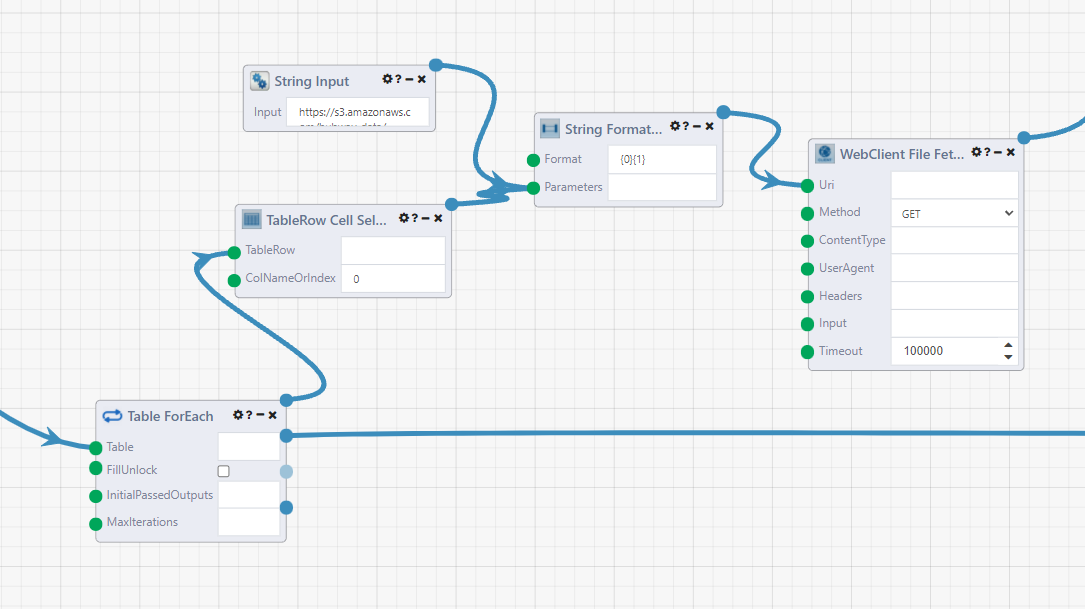
The TableRow Cell Selector module gets the filename string from our table. Into a String Input module, add the base of the url https://s3.amazonaws.com/hubway-data/. Combine these in a String Formatter module with the Format {0}{1}. Make sure you connect the input modules in the correct order.
Connect this to the Uri input of the WebClient File Fetcher module. This is similar to the WebClient module used earlier, but instead the output is the location of where the file is saved on the composable server. Set the Method to GET.
Now, we unzip the files. One thing to watch out for here is that one of the zip files 202104-bluebikes-tripdata.zip also has a __MACOSX folder also included in it, which has a garbage csv file ._202104-bluebikes-tripdata.csv inside, so we take some extra steps to filter it out, because the Csv Reader module will error.
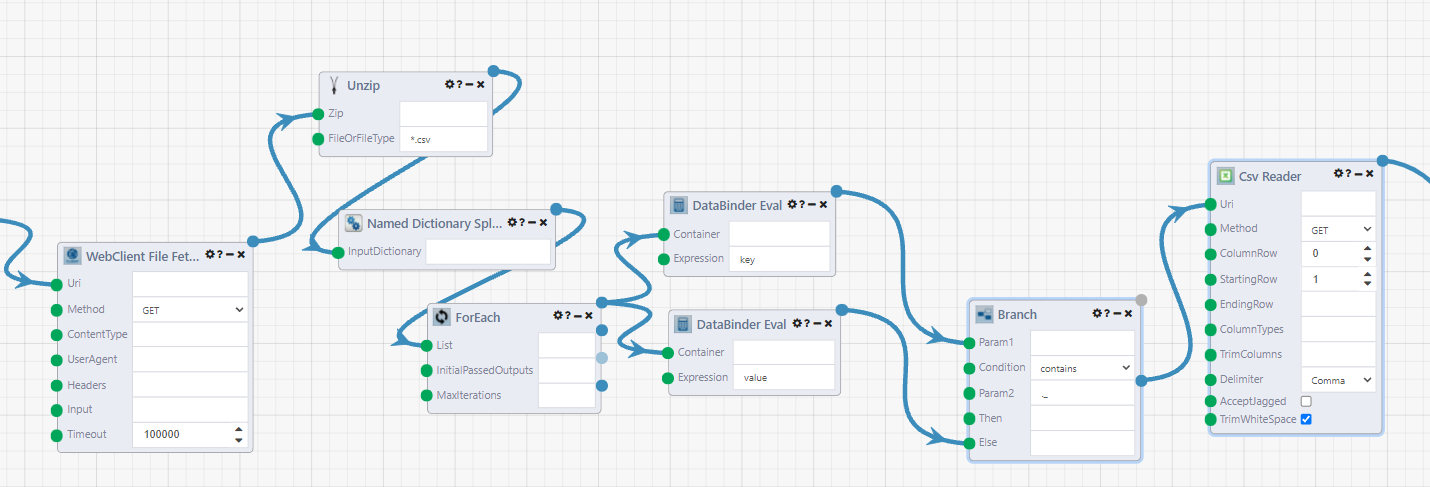
Start with the Unzip module. This returns a dictionary of the files inside the zip directory. Use the Named Dictionary Splitter module to turn it into a list of KeyValue pairs. This allows us to loop through the list of the files and decide whether we want to read them in.
The For Each module creates the loop for each file. Connect the two DataBinder Eval modules. This module is named after the .NET DataBinder Class. We are using it to parse the elements of the key value pair (or other objects). In the first, set the Expression to key. This is the csv filename. Set the second module's Expression to value, this is the uri of the file on the server.
The Branch module in the next step is like an if/else code block, except it outputs a different pathway for each result instead of just one result that changes based on the clause evaluation. Connect the 'key' DataBinder module to Param1 input, and the 'value' one to the Else input. Set the Condition to contains, and Param2 to ._ which is the start of the garbage filename. The Branch module will evaluate to False if is is a correctly named csv file.
Finally, connect the ElseResult output (the second one) of the Branch module to the Csv Reader module. This will read in the csv file to a Composable Table where the table and other modules can operate on it.
As a side note, another way of getting this DataFlow to work would be to go to the Module Settings in the Csv Reader module and changing Continue On Error to False. The DataFlow will continue running, but not continue in the iteration where the module fails.
Combing the Input Files into One Table
Now we combine the tables we got from the csv reader into one table.
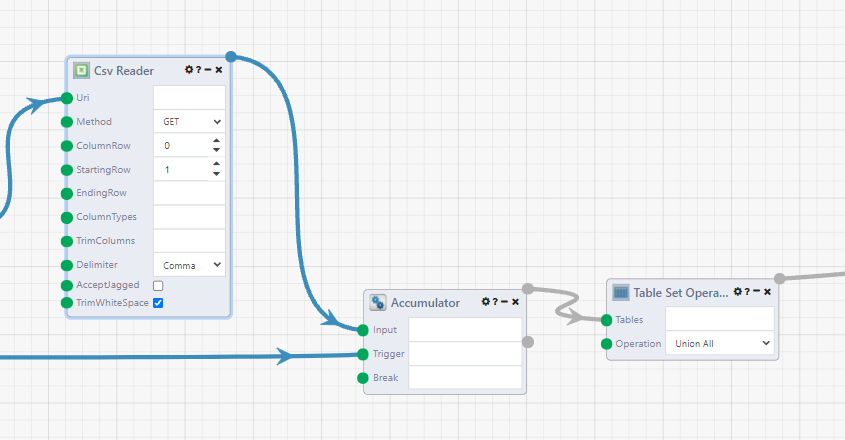
First, connect the Csv Reader to an Accumulator module. This module acts as the end of our Table ForEach loop, and combines the its input results into one list. Connect the Loop Complete (second) output of the Table ForEach module to the Trigger input of the Accumulator module.
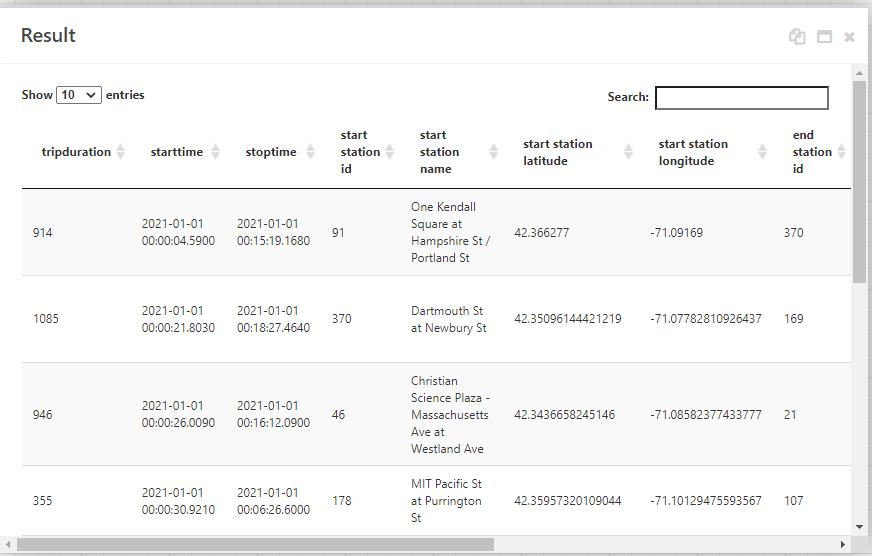
Then the Table Set Operation module with the operation set to Union All to combine the tables together. View the results of the module and you can see our data table.
As an optional step, column names with spaces in them can be annoying to deal with, so we can rename our columns with a Table Query module with the query as
SELECT
TripDuration,
StartTime,
StopTime,
[start station id] AS StartStationID,
[start station name] AS StartStationName,
[start station latitude] AS StartStationLatitude,
[start station longitude] AS StartStationLongitude,
[end station id] AS EndStationID,
[end station name] AS EndStationName,
[end station latitude] AS EndStationLatitude,
[end station longitude] AS EndStationLongitude,
[BikeID],
UserType,
[postal code] AS ZipCode
FROM [t0]
Next Steps
Now that we have the data loaded in, we can start performing our analysis. There are several built-in table modules that can aggregate and perform other operations on your table, or use the Table Query module to query your data with sqlite syntax.
If you're building a data pipeline, and need to store your table in a database, you can set one up with a DataPortal and use the DataPortal Sync module.
The Visualizers dropdown of modules can also create charts.